Teaching Data Literacy in Social Studies: An Interactive Professional Development ToolMain MenuWhat is data literacy?This module provides an introduction to data literacy and its importance for informed and competent citizenship.Why teach data literacy in social studies?Not only is data literacy required by state standards and included in standardized assessments, it is important for understanding core social studies disciplines. This module addresses the role that data visualizations play in social studies standards, assessments, and texts. It also provides links to resources that can be used to support data literacy as a component of disciplinary literacy.What kinds of data visualizations will students encounter in social studies?Information can be visualized in multiple ways, from bar graphs to scatterplots, choropleth maps to distribution maps, timelines to time series. Designers can choose from an array of graphical elements such as points, lines, or icons used to represent data, and multiple aesthetic attributes such as color, shape, and size. Furthermore, designers can apply multiple combinations of titles, legends, and explanatory text to provide context for a data visualization. Given the almost dizzying array of data visualizations students may encounter in social studies, it is helpful to place them in categories related to the types of questions they will help us answer.How do students learn with data visualizations?Reading data visualizations in print and online social studies texts can improve students' overall comprehension and quality of reasoning. And there is evidence to suggest that reading data visualizations helps students better understand historical and geographic context, multiple causation, and change over time — all important concepts for students to grasp in social studies subject areas. However, students may face significant challenges in trying to make sense of different kinds of data visualizations. This section provides insight into both benefits and challenges of reading timelines, maps, and graphs and charts.How should students analyze data visualizations in social studies?The challenges that data visualizations present, coupled with their prevalence in social studies texts, standardized assessments, in online social studies resources, and as sources of information in society, suggest that teaching with and about data visualizations in social studies is essential. This module provides guidance for how teachers can support students' data literacy for social studies.How do I help students create and integrate data visualizations for social studies?This page highlights several tools that are useful for data-based projects in social studies. And accompanying each tool is a "minimal manual" that provides guidance for using the tool in social studies inquiry- and project-based learning.Project-Based Learning Activities for Data Literacy in Social StudiesLorem ipsum dolor sit amet, nec constituto comprehensam te. Sea no affert nemore comprehensam, eum te purto soleat accusata. Ea est magna malis. No atqui iudico est. In vel propriae suavitate. Est homero timeam cu, novum persecuti mea an.Index of Lesson PlansThis page contains a list of the minimal manuals and lessons found on this website. Minimal manuals are designed to be adapted to different grade levels and do not have a grade designation associated with them. Lesson plans are organized according to the school level for which they are designed. However, many of these lessons can be adapted for different grade levels.Tamara Shreiner72eaa2d1ba1352b75b8a8da73e879a4ceb510ae0
Data Visualizations as Primary Sources
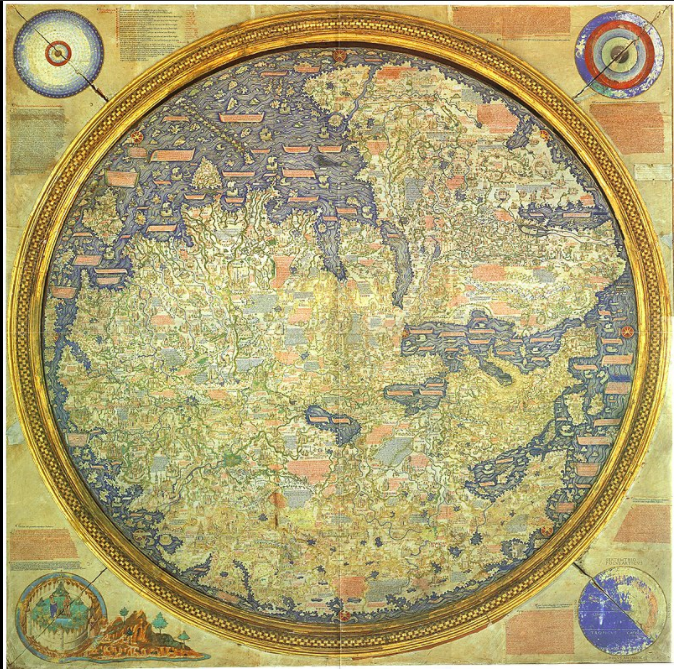
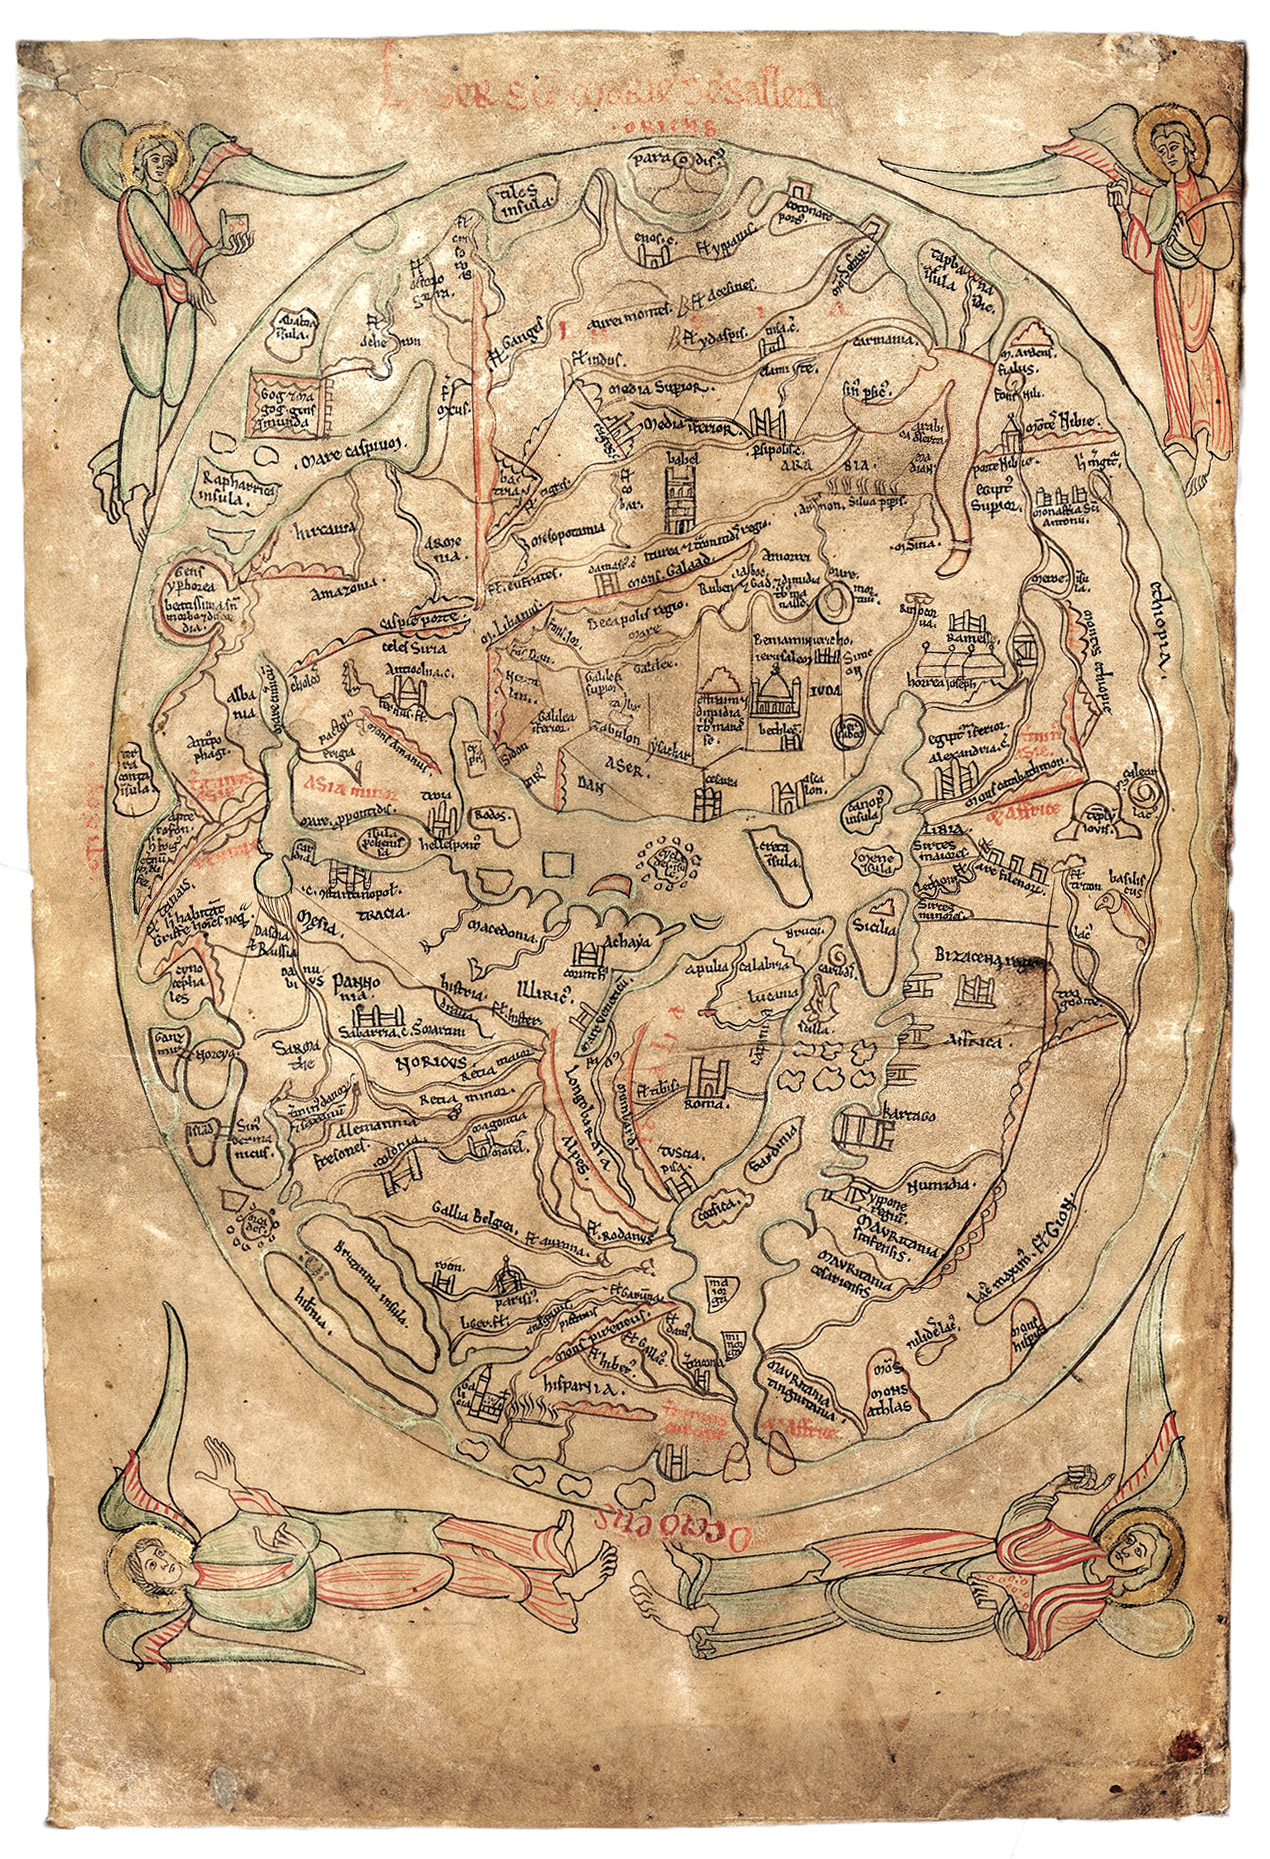
12021-06-21T15:33:50-04:00Benjamin Steinig74775bc5c03628537e0192f4b5deec6811d610f671Humans have been creating different types of data visualizations for centuries. Explore this collection of timelines, maps, graphs and charts to see what they reveal about the historical time and place in which they were produced.plain2021-06-21T15:33:50-04:00Benjamin Steinig74775bc5c03628537e0192f4b5deec6811d610f6Humans have been creating different types of data visualizations for millenia, and data visualizations from across time can be used as primary sources to support inquiry in World History, U.S. History, and Michigan History. Explore this collection of timelines, maps, graphs and charts to see what they reveal about the historical time and place in which they were produced.
World History & Geography
U.S. History & Geography
Michigan History & Geography
This page has paths:
12021-06-21T15:33:56-04:00Benjamin Steinig74775bc5c03628537e0192f4b5deec6811d610f6Why teach data literacy in social studies?Benjamin Steinig1Not only is data literacy required by state standards and included in standardized assessments, it is important for understanding core social studies disciplines. This module addresses the role that data visualizations play in social studies standards, assessments, and texts. It also provides links to resources that can be used to support data literacy as a component of disciplinary literacy.plain9165352021-06-21T15:33:56-04:00Benjamin Steinig74775bc5c03628537e0192f4b5deec6811d610f6
Contents of this path:
12021-06-21T15:33:49-04:00Benjamin Steinig74775bc5c03628537e0192f4b5deec6811d610f6Primary Source Data Visualizations for World History and Geography4This page provides a list of primary source data visualizations to support inquiry in world history and geography. They are organized according to the periodization scheme in Michigan's social studies standards for world history.plain2022-01-27T01:59:24-05:001150 BCETamara Shreiner72eaa2d1ba1352b75b8a8da73e879a4ceb510ae0
12021-06-21T15:33:49-04:00Benjamin Steinig74775bc5c03628537e0192f4b5deec6811d610f6A Timeline of Data Visualizations for World History & Geography5This page contains a timeline with all the site's data visualizations related to world history and geography. You can scroll through the timeline to look for patterns over time, or you can focus on a particular year or time frame.plain2021-11-17T21:40:37-05:00Benjamin Steinig74775bc5c03628537e0192f4b5deec6811d610f6
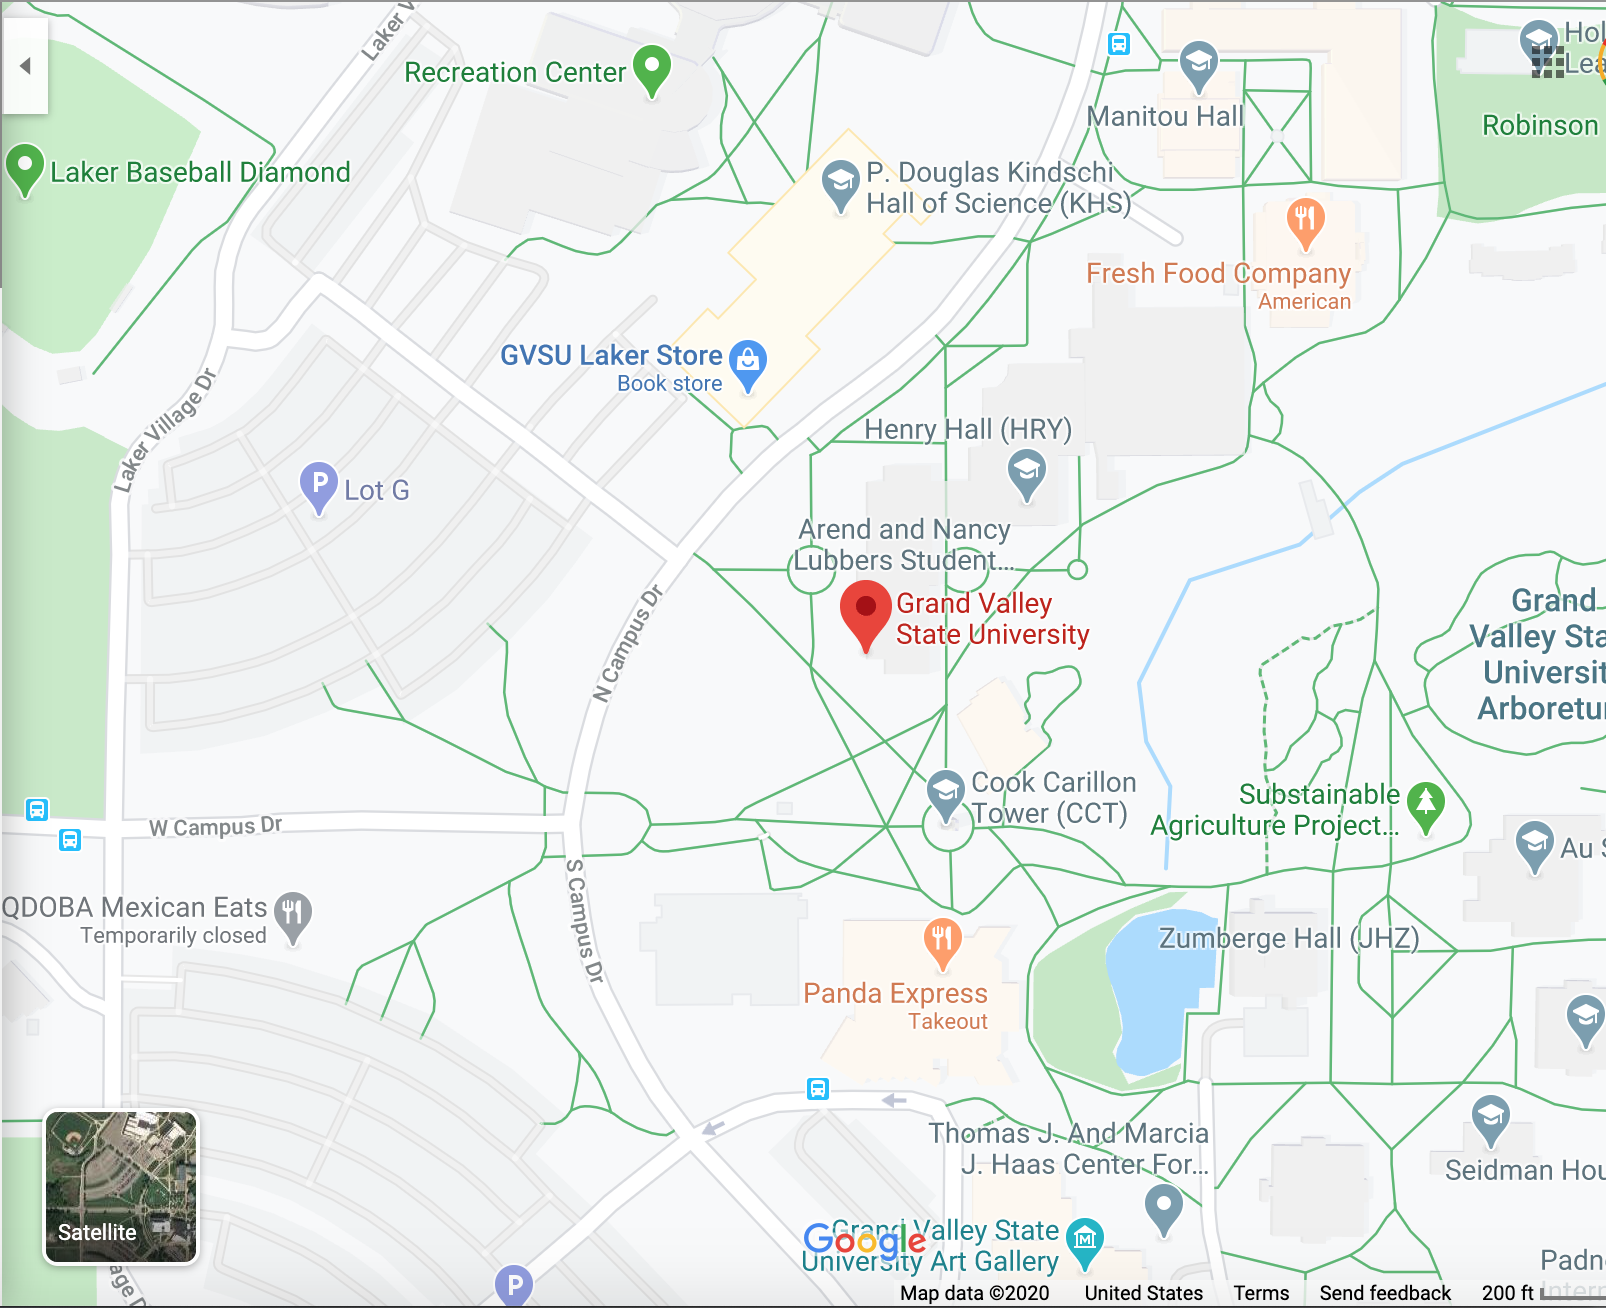
12021-06-21T15:33:50-04:00Benjamin Steinig74775bc5c03628537e0192f4b5deec6811d610f6Map of Data Visualizations for World History & Geography1This page contains a Google map with the approximate origins of the data visualizations that can be used to support inquiry in world history and geography. Use the map to study data visualizations from a particular nation-state, region, or continent.plain2021-06-21T15:33:50-04:00Benjamin Steinig74775bc5c03628537e0192f4b5deec6811d610f6
12021-06-21T15:33:49-04:00Benjamin Steinig74775bc5c03628537e0192f4b5deec6811d610f6Primary Source Data Visualizations for U.S. History & Geography6This page provides a list of primary source data visualizations to support inquiry in U.S. history and geography. They are organized according to the periodization scheme in Michigan's social studies standards for U.S. history.plain2022-02-09T23:49:51-05:00Benjamin Steinig74775bc5c03628537e0192f4b5deec6811d610f6
12021-06-21T15:33:49-04:00Benjamin Steinig74775bc5c03628537e0192f4b5deec6811d610f6A Timeline of Data Visualizations for U.S. History & Geography3This page contains a timeline with all the site's data visualizations related to U.S. history and geography. You can scroll through the timeline to look for patterns over time, or you can focus on a particular year or time frame.plain2021-07-22T21:33:18-04:00Kristen Taurence096bf11ea9ce4df55aba17c3029242306dd910c3
12021-06-21T15:33:50-04:00Benjamin Steinig74775bc5c03628537e0192f4b5deec6811d610f6Map of Data Visualizations for U.S. History & Geography2This page contains a Google map with the approximate origins of the data visualizations that can be used to support inquiry in U.S. history and geography. Use the map to study data visualizations from a particular state or region in the United States, or data visualizations people from other countries created about the United States.plain2021-07-22T21:34:24-04:00Kristen Taurence096bf11ea9ce4df55aba17c3029242306dd910c3
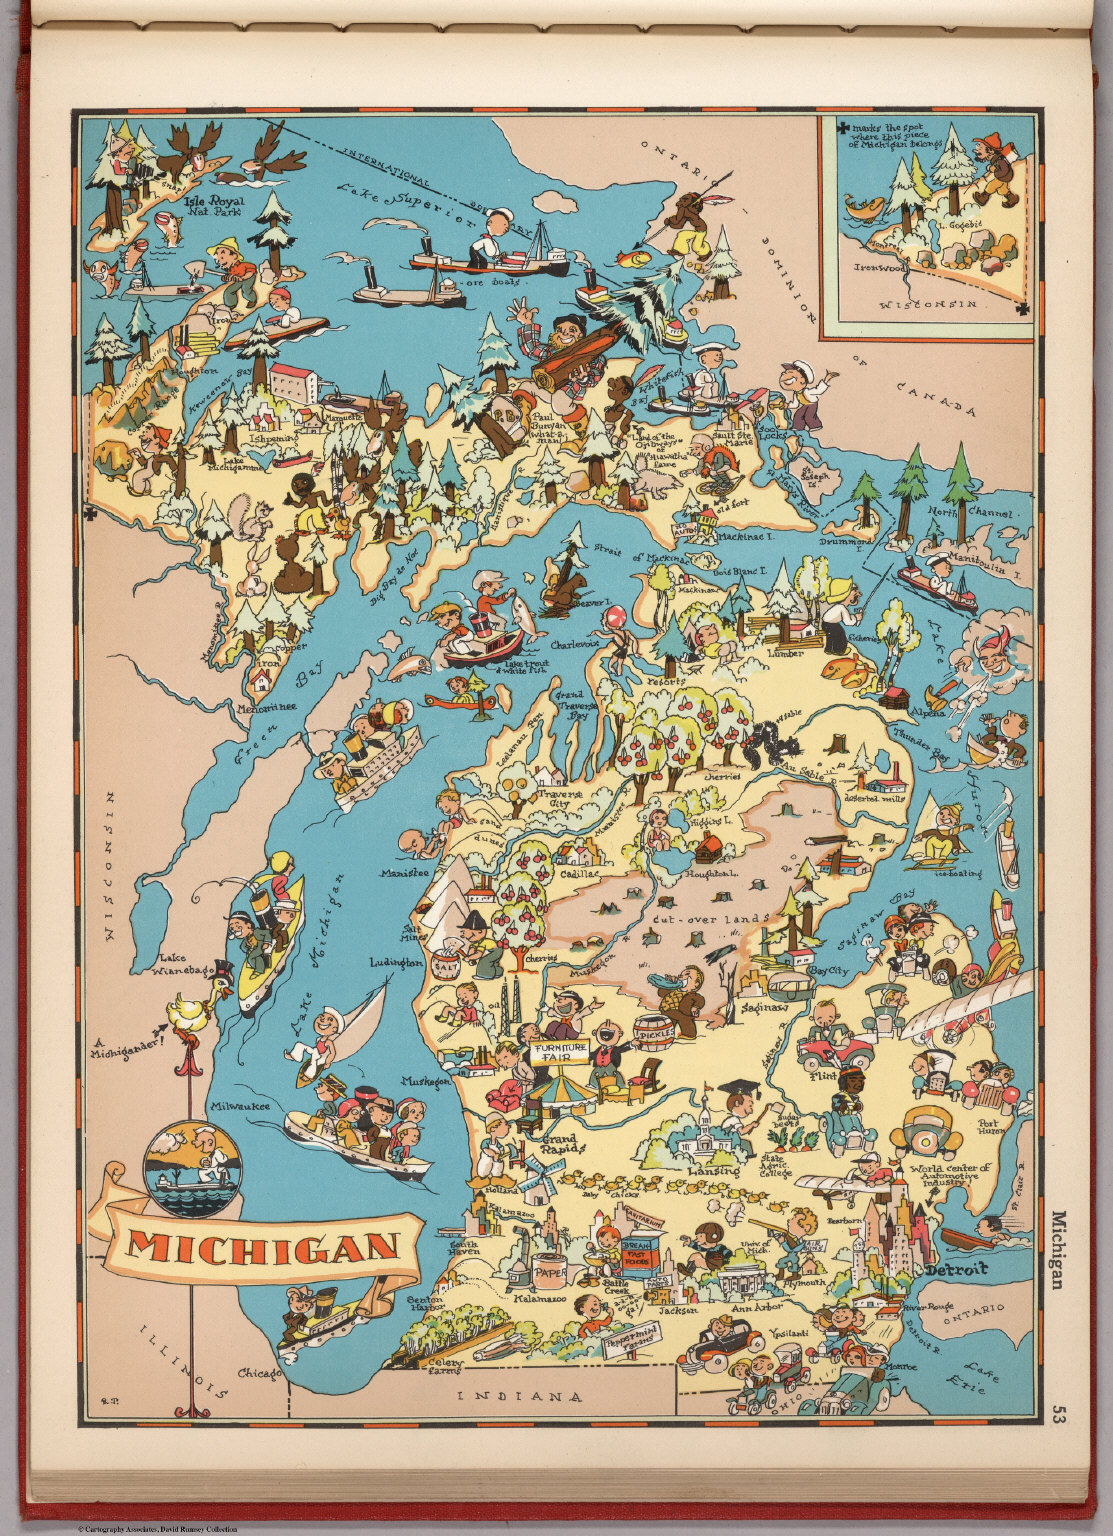
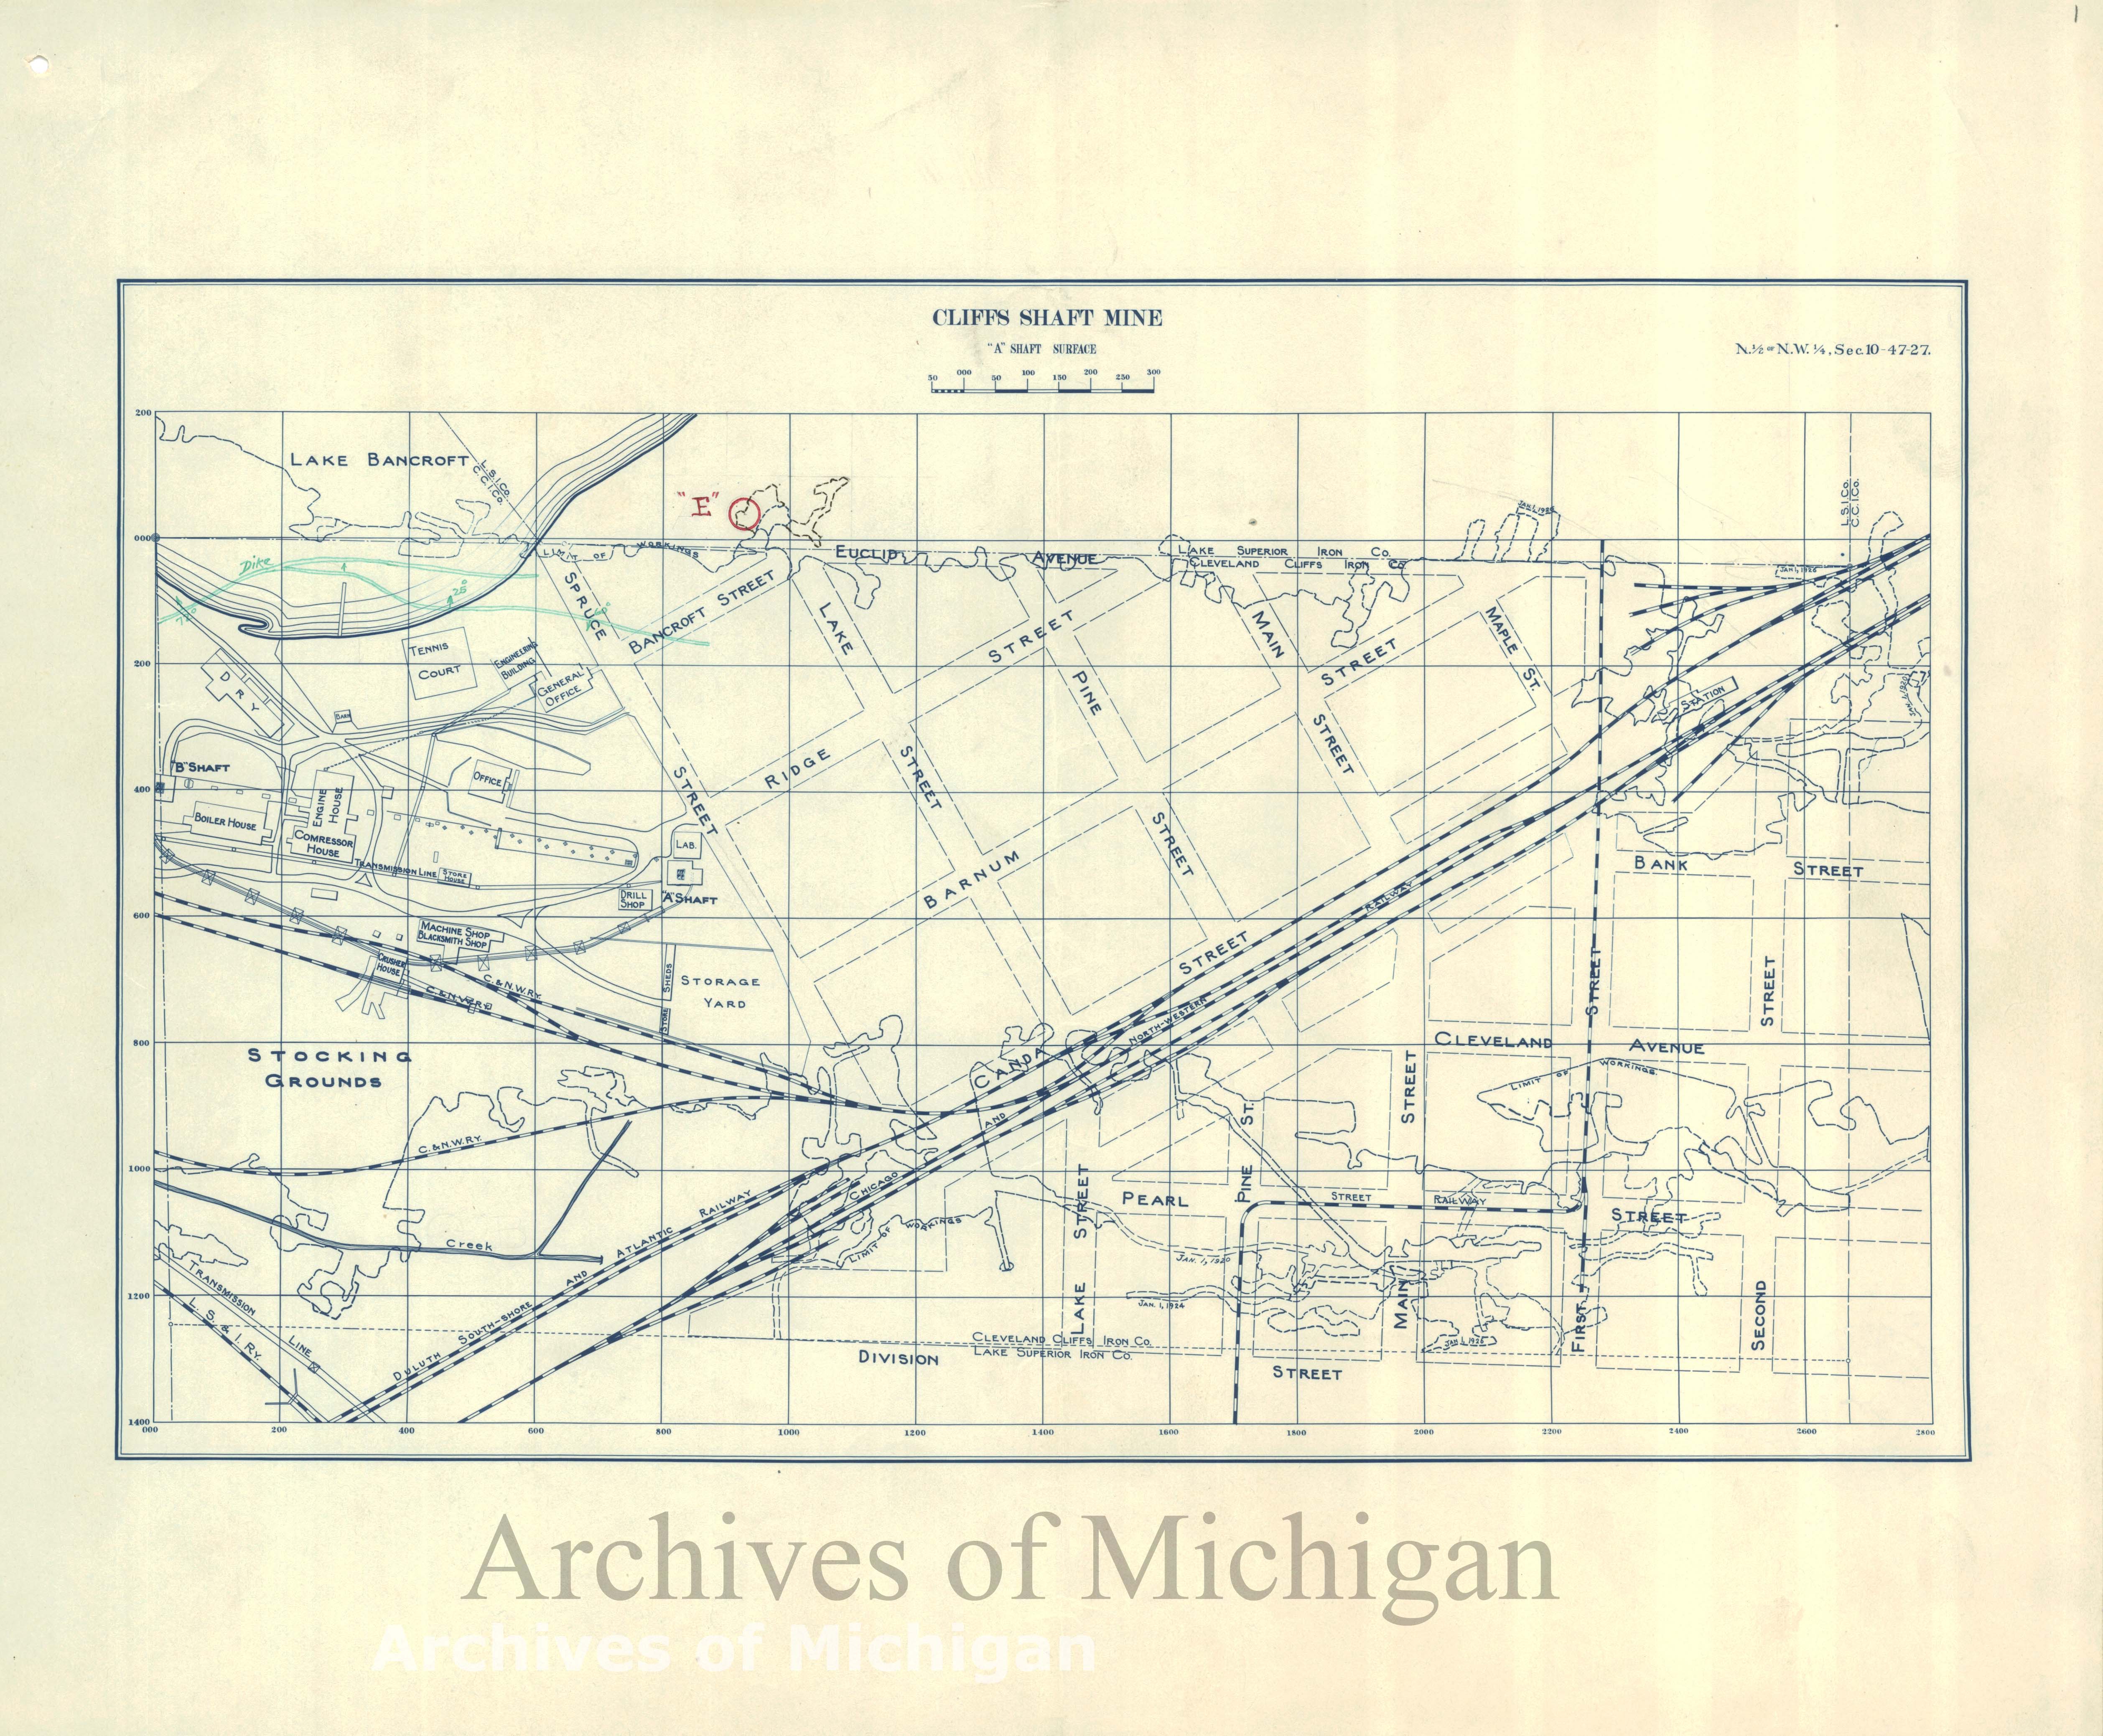
12021-06-21T15:33:50-04:00Benjamin Steinig74775bc5c03628537e0192f4b5deec6811d610f6Primary Source Data Visualizations for Michigan History1This page provides a list of primary source data visualizations to support inquiry in Michigan history. They are organized according to the scope and sequence in Michigan's social studies standards, which has students studying Michigan before statehood in third grade, and after statehood in fourth grade.plain2021-06-21T15:33:50-04:00Benjamin Steinig74775bc5c03628537e0192f4b5deec6811d610f6
12021-06-21T15:33:49-04:00Benjamin Steinig74775bc5c03628537e0192f4b5deec6811d610f6A Timeline of Data Visualizations for Michigan History1This page contains a timeline with all the site's data visualizations related to Michigan history. You can scroll through the timeline to look for patterns over time, or you can focus on a particular year or time frame.plain2021-06-21T15:33:49-04:00Benjamin Steinig74775bc5c03628537e0192f4b5deec6811d610f6
12021-06-21T15:33:49-04:00Benjamin Steinig74775bc5c03628537e0192f4b5deec6811d610f6A Map of Data Visualizations for Michigan History1This page contains a Google map with the approximate origins of the data visualizations that can be used to support inquiry in Michigan history. Use the map to study data visualizations from a particular state or region in the United States, or data visualizations people from other countries created about Michigan.plain2021-06-21T15:33:49-04:00Benjamin Steinig74775bc5c03628537e0192f4b5deec6811d610f6